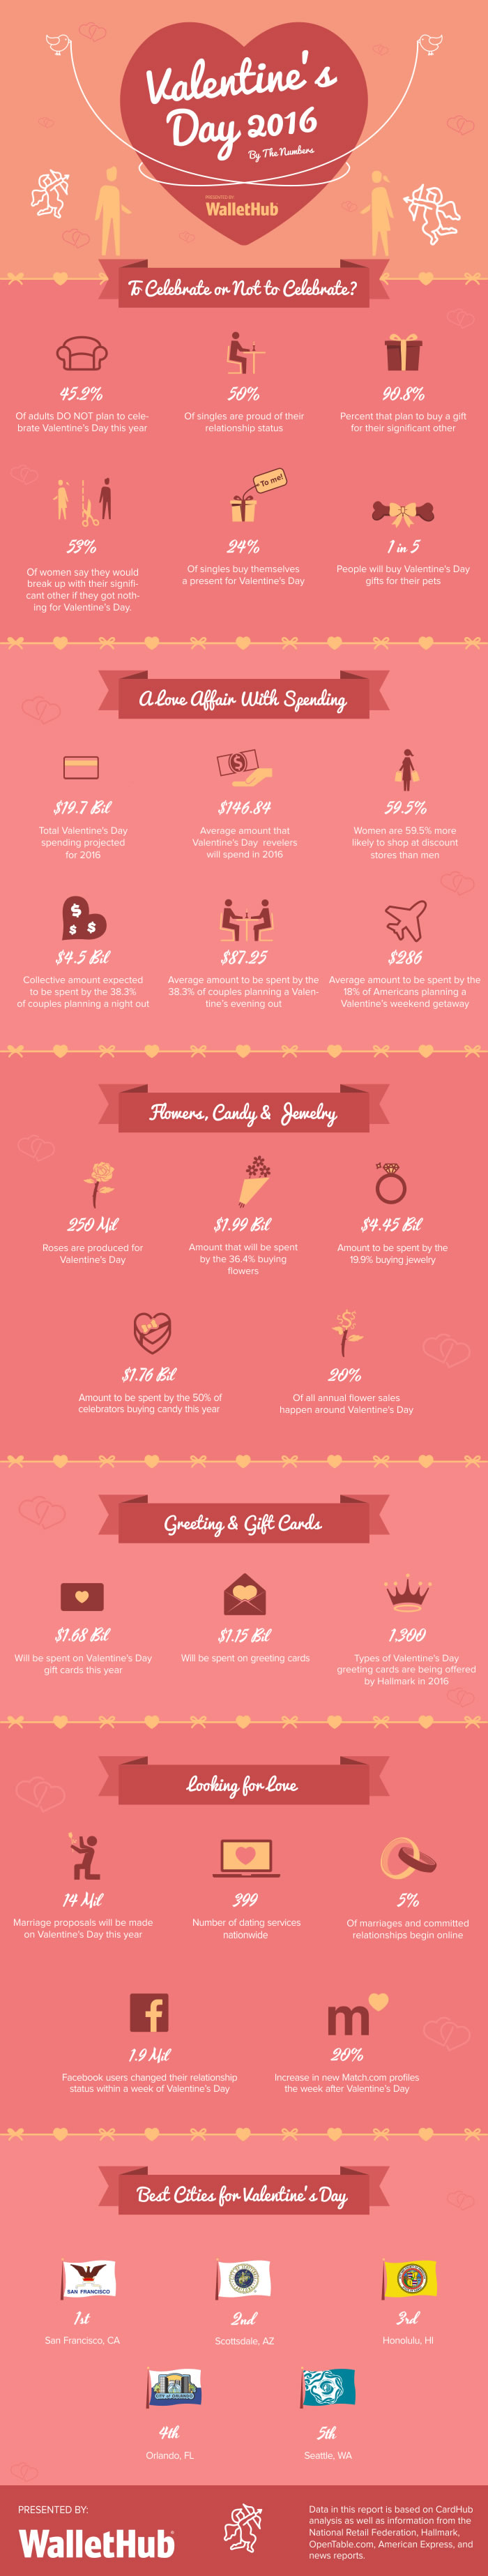
Valentine’s Day is the third largest consumer holiday in the United States by amount spent. We spend $19.7 billion in Cupid’s name each year coming in just behind the $21.2 billion spent on Mother’s Day and the $630.5 billion we devote to the winter holidays. There’s no denying St. Valentine’s impact on our nation’s economy.
To help people embrace Valentine’s Day loving feeling in a manner that’s safe for their wallets, the following infographic showcases participation rates, spending trends and other fascinating tidbits about this romantic day. Here are some highlights:
- $19.7 Bil: Total Valentine’s Day spending projected for 2016.
- $146.84: Average amount that Valentine’s Day revelers will spend in 2016.
- 53%: Of women say they would break up with their significant other if they got nothing for Valentine’s Day.
- 14 Mil: Proposals are made on Valentine’s Day.
Best & Worst Cities For Valentine’s Day 2016
| Best Cities: | Worst Cities: | ||||
| 1 | San Francisco, CA | 96 | Newark, NJ | ||
| 2 | Scottsdale, AZ | 97 | San Bernardino, CA | ||
| 3 | Honolulu, HI | 98 | Cleveland, OH | ||
| 4 | Orlando, FL | 99 | Detroit, MI | ||
| 5 | Seattle, WA | 100 | Hialeah, FL | ||
How Does Flower and Candy Spending Rank? See Below.